
Betting Tracker Spreadsheet: What You Should Be Recording
 Available in US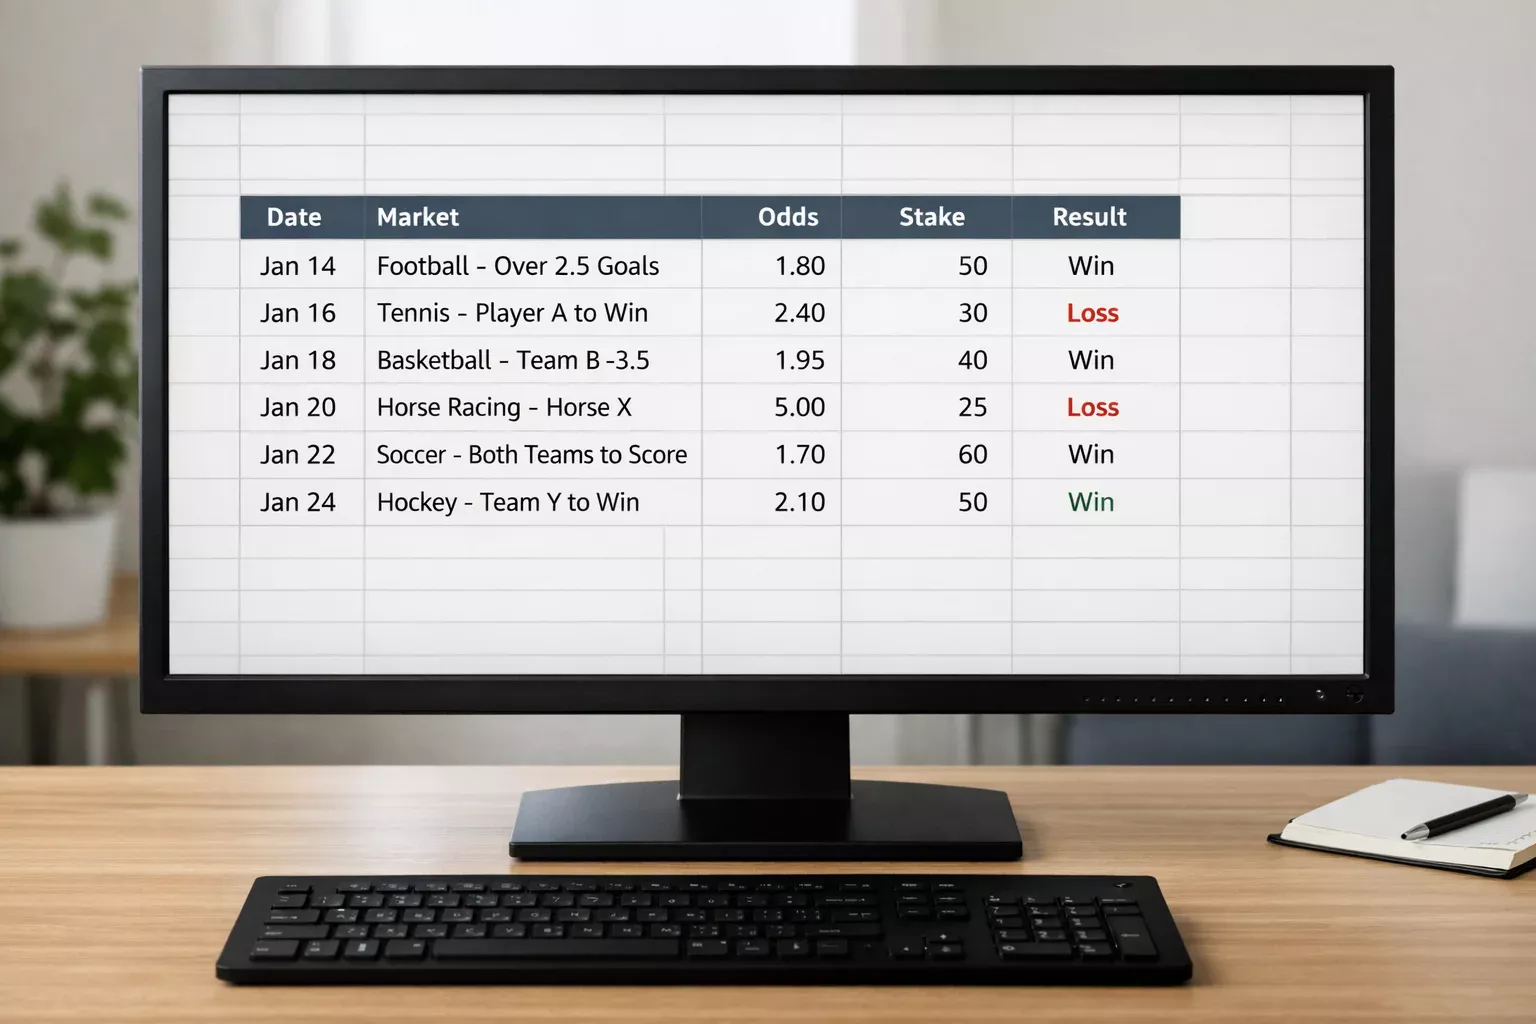
The difference between bettors who improve and those who repeat mistakes often comes down to tracking. Without systematic records, you're navigating Championship betting with no map and no memory — making the same errors repeatedly while assuming you're learning from experience. A properly designed betting tracker transforms vague impressions into concrete data, revealing patterns that guide genuine improvement.
Most bettors either don't track at all or track superficially, recording wins and losses without the detail needed for meaningful analysis. The reluctance is understandable — tracking requires effort, and facing documented losses feels worse than vaguely remembering them. Yet this discomfort represents exactly why tracking matters: the honest feedback it provides enables changes that comfortable ignorance cannot.
Essential Data Points to Capture
Every bet should record the date and time of placement. This information enables analysis of whether certain days or times produce better results. Some bettors perform better with pre-match analysis; others make their best decisions in-play. Without date-time data, these patterns remain invisible.
Record the specific selection in detail: match, market type, and precise pick. "Coventry -1 Asian Handicap" provides analysis value; "Coventry bet" does not. The selection record should allow you to reconstruct exactly what you wagered on without relying on memory.
Document odds at placement. Odds reveal implied probability and enable value assessment retrospectively. Did you consistently take shorter odds than closing lines? Did your winning selections tend to have certain odds ranges? This analysis requires having the original odds recorded.
Stake amount matters even beyond bankroll tracking. Recording stakes enables analysis of whether your stake sizing affects results. Some bettors may find their higher-confidence large-stake bets actually underperform their standard stakes — crucial information for refining staking strategy.
Record outcome clearly: win, loss, void, or partial (for Asian handicap pushes). Calculate actual profit/loss for each bet. A £10 bet at 2.50 that wins produces £15 profit, not £25. Maintaining this distinction prevents inflated perception of results.
Beyond Basics: Analysis-Enabling Fields

Pre-bet reasoning deserves a dedicated column. Why did you make this selection? What factors supported it? Recording reasoning enables retrospective analysis of which factors actually correlate with success. You might discover your "strong value" assessments predict outcomes while your "form" assessments don't — information that should reshape future analysis.
Confidence ratings add dimension to tracking. Rate each bet 1-5 for confidence before placement. Later analysis reveals whether high-confidence bets actually produce better results. If they don't, your confidence calibration needs adjustment. If they do, perhaps higher-confidence bets deserve larger stakes.
Bookmaker identification helps track which platforms offer best value for your betting patterns. Recording which bookmaker you used enables comparison of results across platforms and identification of where you consistently find better odds.
Market categorisation supports focused analysis. Tags like "match result," "Asian handicap," "over/under goals," or "bet builder" enable filtering to assess performance by market type. Perhaps you excel at goal markets but struggle with handicaps — tracking reveals this.
Calculated Metrics for Performance Assessment
Running profit/loss in both currency and units provides essential context. Currency profit shows actual financial impact; unit profit reveals performance independent of stake size. A bettor up £200 from 1000 units risked performs very differently from one up £200 from 100 units risked.
Return on Investment (ROI) measures efficiency across volume. Calculate as (Total Profit / Total Stakes) × 100. A 5% ROI means you return £105 for every £100 staked. This percentage enables comparison across periods with different betting volumes and provides the key metric for assessing long-term viability.
Strike rate (winning percentage) matters but requires context. 40% strike rate at average 2.80 odds produces positive ROI; 40% at average 2.20 odds produces losses. Track strike rate alongside average odds to assess whether your win frequency matches your odds profile.
Yield by market type, by day, by bookmaker — various filtered calculations reveal where your edge actually exists. Perhaps your Saturday afternoon bets dramatically outperform your Monday night picks. Without segmented analysis, this actionable insight remains hidden.
Spreadsheet Structure Recommendations
Columns should flow logically from bet placement through outcome. A sensible sequence: Date, Match, Market, Selection, Odds, Stake (units), Stake (£), Reasoning, Confidence, Bookmaker, Outcome, Profit/Loss (units), Profit/Loss (£), Running Total (units), Running Total (£).
Use data validation to enforce consistency. Drop-down menus for market types, bookmakers, and outcomes prevent typos that complicate later filtering. "Asian Handicap" and "asian handicap" look the same to humans but cause problems for spreadsheet functions.
Separate sheets for different time periods (monthly or quarterly) prevent files from becoming unwieldy while enabling period-specific analysis. A summary sheet pulling totals from period sheets provides high-level overview.
Conditional formatting adds visual clarity. Red highlighting for losses, green for wins, yellow for voids enables quick visual scanning. Formatting that highlights your best and worst performing market types draws attention to patterns deserving further investigation.
Analysis Routines and Reviews
Weekly quick review takes five minutes and catches emerging patterns. How many bets this week? What's the week's ROI? Any obvious problems? This brief check-in maintains awareness without demanding extensive time investment.
Monthly detailed review deserves thirty minutes to an hour. Calculate monthly metrics across all categories. Compare to previous months. Identify your best and worst market types, your most profitable days, your bookmaker producing best odds. Document findings and specific action points.
Quarterly strategic review examines longer-term patterns less visible in monthly data. Is your ROI improving, declining, or flat across quarters? Have market type performances remained consistent? What worked this quarter that should be emphasised? What failed that should be reduced or eliminated?
Annual comprehensive analysis provides the broadest perspective. Calculate yearly metrics and compare to previous years if available. Assess whether your approach is generating sustainable edge or whether the positive periods represent variance rather than skill.
Common Tracking Mistakes to Avoid
Selective recording — logging wins while "forgetting" losses — destroys tracking value entirely. The entire purpose is honest assessment, which requires complete recording. If you're not willing to record losses as faithfully as wins, you're not ready for useful tracking.
Abandoning tracking during losing streaks eliminates precisely the data that would reveal what went wrong. Losing periods provide the most valuable learning opportunities, but only if you maintain records through them. Tracking should continue regardless of results.
Excessive complexity discourages maintenance. A spreadsheet with thirty columns requiring five minutes per bet won't be maintained consistently. Start simple; add complexity only when you've demonstrated you'll maintain basic tracking reliably.
Never reviewing recorded data wastes the effort of recording. Tracking without analysis is just documentation — the value emerges from examining what you've documented. Schedule reviews and actually perform them.
Using Tracking Data for Improvement

Pattern identification from data should drive strategy adjustment. If data reveals your in-play bets consistently underperform, reduce or eliminate in-play betting. If goal markets produce your best ROI, emphasise goal markets. Let evidence guide evolution rather than untested assumptions.
Hypothesis testing becomes possible with good data. Think your Saturday selections are better? Filter for Saturday and compare metrics. Suspect confidence ratings don't correlate with results? Calculate performance by confidence level. Data provides answers to questions you can formulate.
External comparison to documented benchmarks reveals where you stand. Professional bettors target 3-5% long-term ROI; recreational bettors often show negative ROI. Understanding typical ranges helps interpret whether your results represent edge, luck, or loss.
Honest self-assessment emerges from facing documented reality. The bettor who feels successful but shows negative ROI over 500 tracked bets faces a choice: adjust approach or continue with proven losing strategy. Tracking creates the accountability that vague impressions cannot.
Getting Started Today
Create your spreadsheet now, even if just basic columns. The best system is one you'll actually use; start simple and add sophistication as habits develop. Even just recording selection, odds, stake, and outcome provides valuable data.
Commit to recording every bet before placing it. The act of documentation creates a small pause that supports thoughtful decision-making while ensuring complete records.
Schedule your first weekly review for seven days from now. Put it in your calendar. The data you record this week becomes your first analysis subject. This immediate feedback loop demonstrates tracking value and reinforces the habit.
A betting tracker transforms Championship betting from activity into measured pursuit. The thirty seconds spent recording each bet pays dividends through insights that guide genuine improvement. Bettors serious about long-term success consider tracking not optional but essential — the foundation upon which sustainable betting is built.
